

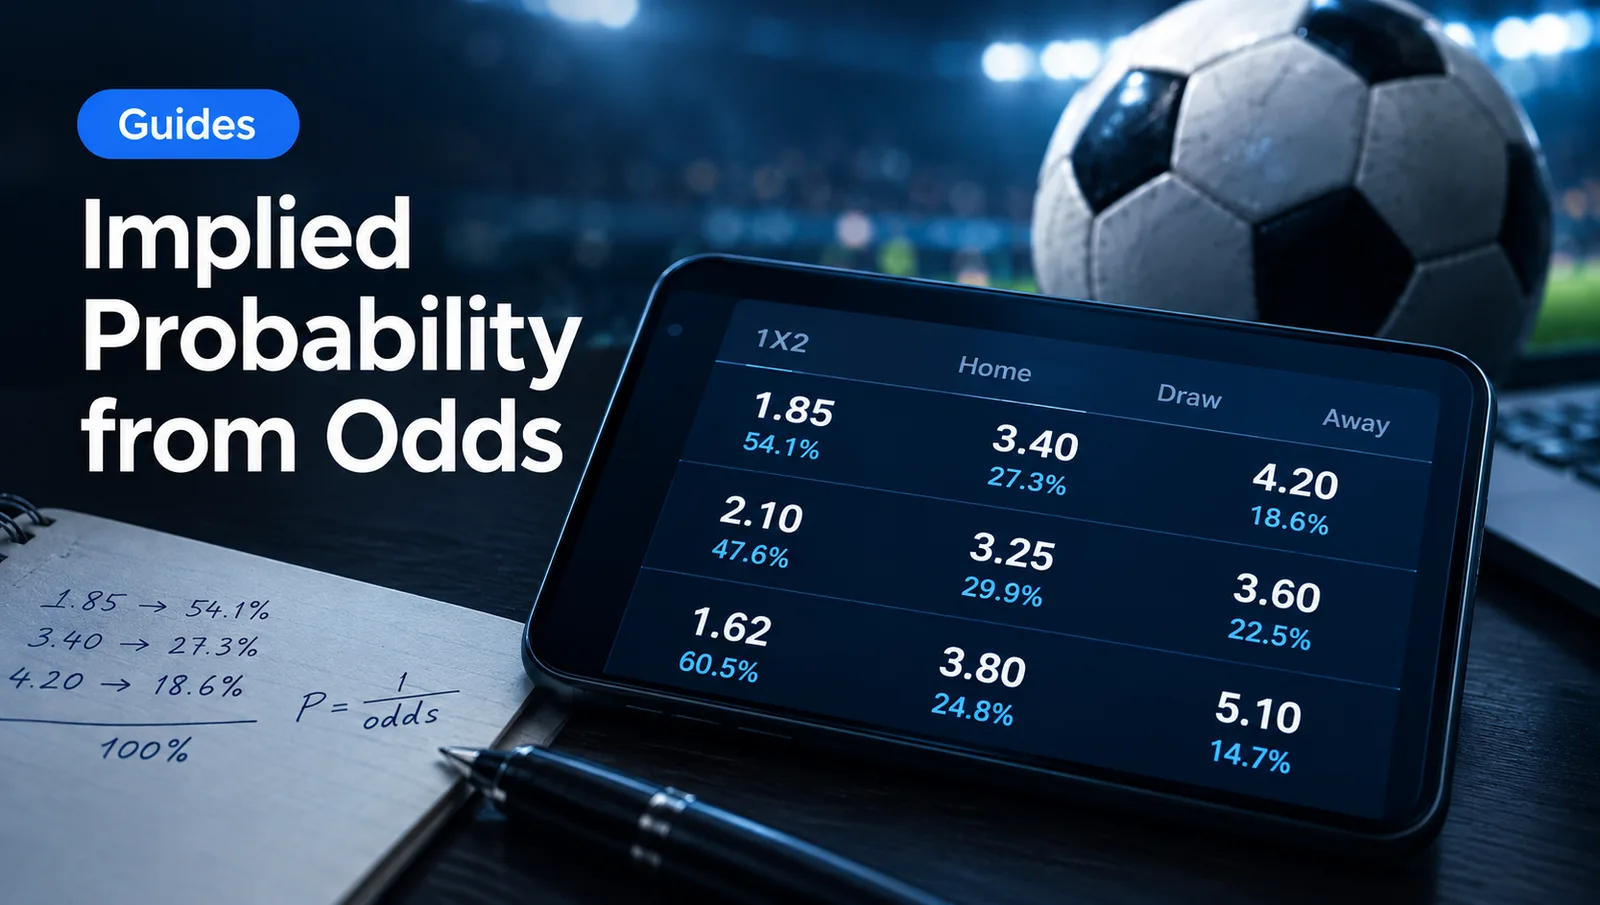
Implied Probability from Odds: Formula and Free Calculator
Every price a bookmaker publishes hides a probability. Converting it to a percentage takes one division, but most bettors never bother and reason from the raw odds instead. This guide covers the formulas for all three major odds formats with worked examples, and a free calculator below lets you run any line in seconds.
What Is Implied Probability
Implied probability is the chance of an outcome baked into the odds. It answers one question: how often would this bet have to win to break even? If a bookmaker prices a team to win at decimal odds of 2.50, they are implying that the team wins roughly 40% of the time.
The figure isn't a clean probability estimate. It includes the bookmaker's margin, so in any given market the implied probabilities across all outcomes will add up to more than 100%. A standard 1X2 match market typically sums to 105-108% total implied probability, and that excess is the overround - how the bookmaker builds in its edge. A calculator handles the math quickly, but the output still carries that margin. Removing it — to find the no-vig fair probability — requires an extra calculation covered separately.
If your model outputs probabilities, comparing them against raw odds is awkward. Comparing them against implied probability figures is direct - both are expressed in the same unit. A calculator makes that translation fast. If your model puts a team's win probability at 60% and the market implies 51%, the structure of that comparison is clear. Whether the gap represents real value depends on your model's calibration - but the arithmetic is the starting point.
Formula for Decimal Odds
Decimal odds are the default format across European bookmakers, most online exchanges, and the majority of international betting platforms. The formula to convert them to an implied probability is:
Implied Probability (%) = (1 / Decimal Odds) x 100
At 2.00, that gives exactly 50%. At 1.50, it gives 66.7%. At 3.50, it gives 28.6%.
Decimal odds show total return per unit staked, stake included. The reciprocal of that figure is the breakeven frequency — the win rate at which you'd return zero net profit over a large sample. Because the stake is already folded into the decimal figure, the formula needs no adjustment for it.
Worked example: a team is priced at 1.91, which is a common line on a roughly 50-50 outcome after a bookmaker margin is applied. The implied probability is 1/1.91 x 100 = 52.4%. Check both sides of the same market - if the opposing outcome is also at 1.91, the other side also shows 52.4%, and the two sum to 104.8%. That 4.8% is the bookmaker's margin - its expected cut across all money on the market.
So the figure you get from raw decimal odds isn't a neutral estimate. Every price carries margin on top of the underlying probability. The size of that margin varies across operators and across market types; niche markets tend to carry higher overrounds than major match lines.
Formula for American Odds
American odds, also called moneyline odds, split into two variants depending on the sign of the number.
Positive lines - these cover underdogs. At +150 or +200, the number represents profit on a 100-unit stake.
Implied Probability (%) = 100 / (American Odds + 100) x 100
At +150: 100 / (150 + 100) x 100 = 40%. At +300: 100 / (300 + 100) x 100 = 25%.
Negative lines - these cover favorites. At -200 or -110, the number represents how much you must stake to net 100 units in profit
Implied Probability (%) = |American Odds| / (|American Odds| + 100) x 100
At -200: 200 / (200 + 100) x 100 = 66.7%.
At -110 (a standard NFL spread): 110 / (110 + 100) x 100 = 52.4%.
The two formulas differ because the formats mean different things: profit per 100 staked, versus stake needed to net 100. A -200 favorite at 66.7% means the market prices it at roughly two-in-three.
One use beyond analysis: the percentage feeds directly into stake sizing. Fractional Kelly needs a probability estimate and an edge estimate. The margin-stripped figure gives you the market's baseline for the first.
Formula for Fractional Odds
Fractional odds express profit relative to stake. Odds of 5/2 mean five units of profit for every two units staked - equivalent to decimal odds of 3.50. The conversion formula is:
Implied Probability (%) = Denominator / (Denominator + Numerator) x 100
For 5/2: 2 / (2 + 5) x 100 = 28.6%.
For evens (1/1): 1 / (1 + 1) x 100 = 50%.
For 1/3: 3 / (3 + 1) x 100 = 75%.
Use this formula directly if you'd rather not convert to decimals first. The denominator is the stake portion, the numerator is the profit portion - keeping that distinction in mind makes the formula self-evident. The formula produces the same result as the decimal equivalent: for 5/2, the decimal form is 3.50, and 1/3.50 x 100 = 28.6%.
Longer prices - 7/2, 9/2, 11/4 - follow the same pattern. For 7/2: 2 / (2 + 7) x 100 = 22.2%. For 9/4: 4 / (4 + 9) x 100 = 30.8%
Implied Probability Calculator
Enter odds in any format - decimal, fractional, or American - and the calculator returns the implied probability plus the no-vig fair odds. For moneyline lines, it detects the sign of the number automatically and applies the correct formula, so you don't have to pick a variant manually. You get both the raw percentage and the margin-stripped version in one step.
How Bettors Use Implied Probability
Converting to a percentage is just the setup. The comparison that follows is where it matters.
Form your own estimate, then put it next to the market's. If your estimate is higher than the implied figure, the bet is priced in your favor at that bookmaker — at least according to your model. That gap is what bettors call value — a positive expected return based on your estimate. It's the basis of value betting. If your estimate sits below the market's, the price is bad no matter how confident you feel.
Example: your model estimates a team wins with 57% probability. The best available decimal odds are 2.00, implying 50%. Your estimate exceeds the implied figure by 7 percentage points. That's a potential edge — but only as reliable as your model.
Some practical details worth keeping in mind:
- Compare one bookmaker at a time. Bookmaker A and B will show different numbers on the same event - each applies its own margin and pricing model. Cross-book comparison is a separate exercise.
- Lines move. A match priced 48 hours out can shift sharply by kick-off, especially around team news. Yesterday's number may not reflect today's price.
- Estimates carry uncertainty. A model output of 53% against a market of 52% is noise for most approaches. Edge only shows up over a large sample, not on one bet.
The other use is retrospective: track the percentages over a large sample and compare them with actual results. Major leagues in peak season tend to be well-calibrated. Niche competitions with thin liquidity are not - that's where systematic bias, and therefore value, is more likely to hide. Higher margin usually comes with it, so weigh the two against each other.